Results of PGPLOT example 4
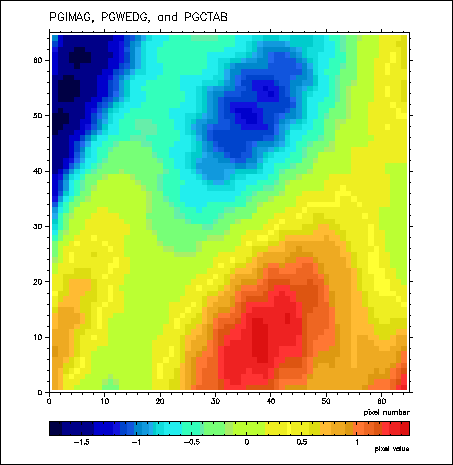
Test of routine PGIMAG which displays a colour image from a 2-D data array.
PGWEDG makes the colour calibration 'wedge' at the
bottom of the plots; PGCTAB installs the colour table used by
PGIMAG.
- Example 4-1
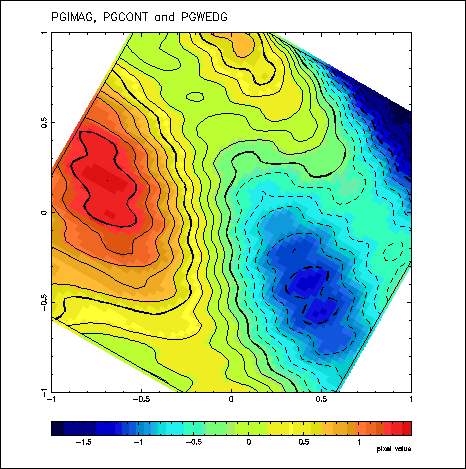
- Example 4-2 same example with different labels on the axes and contour
lines plotted on the image
Page last updated 14 Feb 1999
Use your 'back' icon to return to the previous page or
click here to return to the 'Fortran Friends' home page.