Results of PGPLOT examples 1
There are 14 examples here showing different ways of presenting graphs,
you can either scroll down them in numerical order or click on the number
in the next line to go to the one you want.
1.1, 1.2, 1.3,
1.4, 1.5, 1.6,
1.7, 1.8, 1.9,
1.10, 1.11, 1.12,
1.13, 1.14
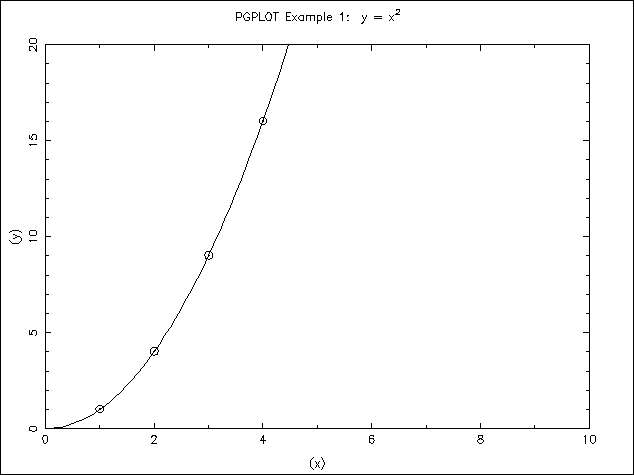
- Example 1-1 uses
- PGENV to specify the range of the axes and to draw a box
- PGLAB to label it
- PGPT to plot points as little circles
- PGLINE to draw a line representing a function
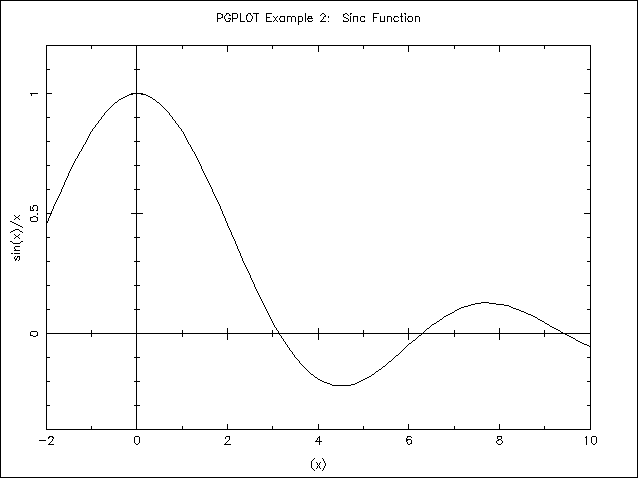
- Example 1-2 similar to 1-1 but draws the function SIN(X)/X
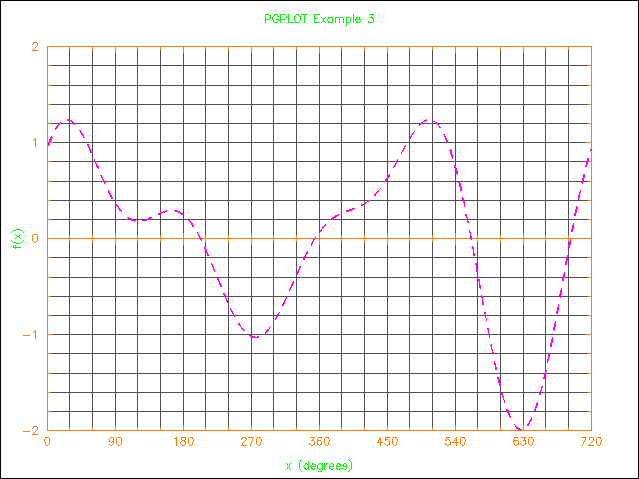
- Example 1-3 uses
- PGSAVE and PGUNSA to save and restore plot characteristics
- PGSCI to change colours
- PGBOX to draw a grid
- PGSLS and PGSLW to change line characteristics
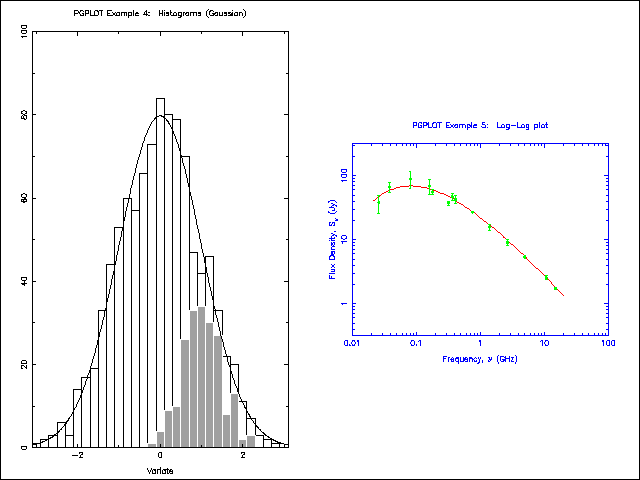
- Example 1-4 shows a histogram (example 4) and a log-log plot with
data points (example 5); it uses
- PGRNRM to generate a pseudo-random frequency distribution
- PGHIST to plot it as a histogram with a theoretical distribution
superimposed
also shown is a log-log plot of a frequency distribution; the points are
plotted with error bars using PGERRY.
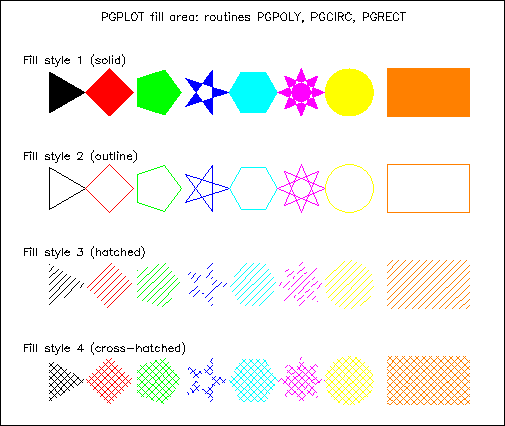
- Example 1-5 shows how to draw filled areas; it uses
- PGPOLY for polygons
- PGCIRC for circles
- PGRECT for rectangles
with solid, outline, hatched and cross-hatched filling methods.
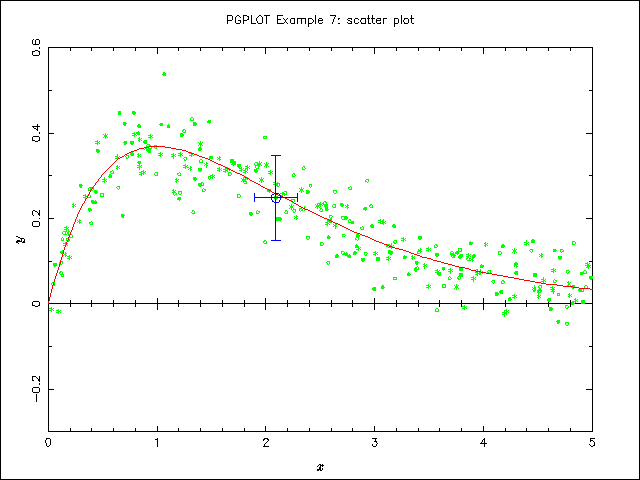
- Example 1-6 shows various symbols used for plotting points
deviating randomly from a parent distribution drawn as a curve.
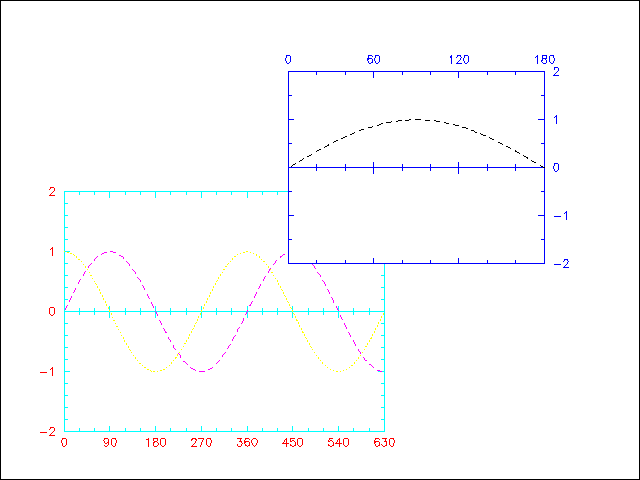
- Example 1-7 shows some of the possibilities for overlapping windows and
viewports
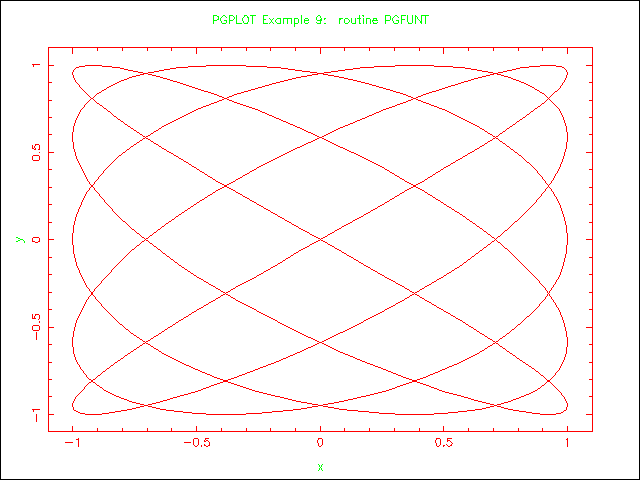
- Example 1-8 illustrates curve drawing with PGFUNT (Lissajous' figure)
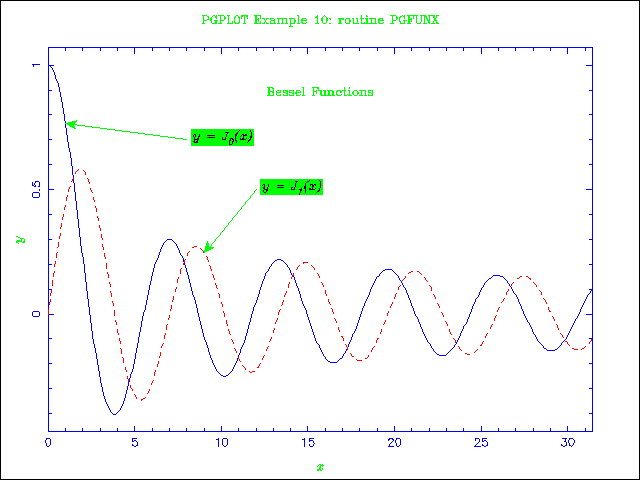
- Example 1-9 illustrates curve drawing with PGFUNX and shows how
to make a 'legend' with arrows pointing to the curves
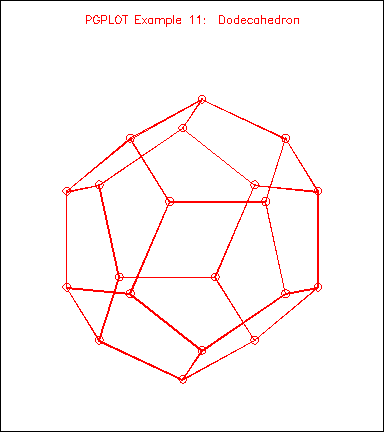
- Example 1-10 draws a skeletal dodecahedron
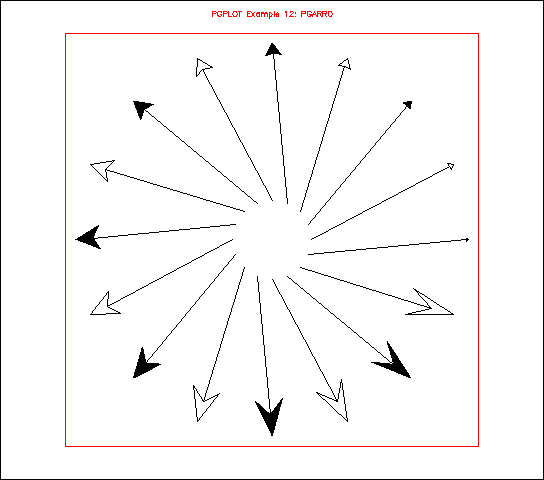
- Example 1-11 shows the range of arrows which can be drawn
with PGARRO
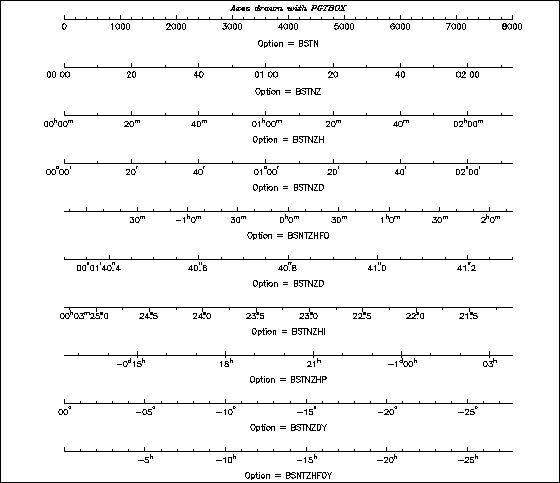
- Example 1-12 shows the use of PGTBOX for making the scales
and labelling axes
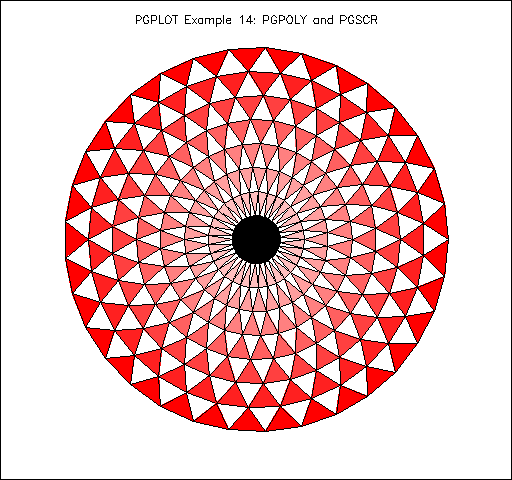
- Example 1-13 polygon fill and colour representation
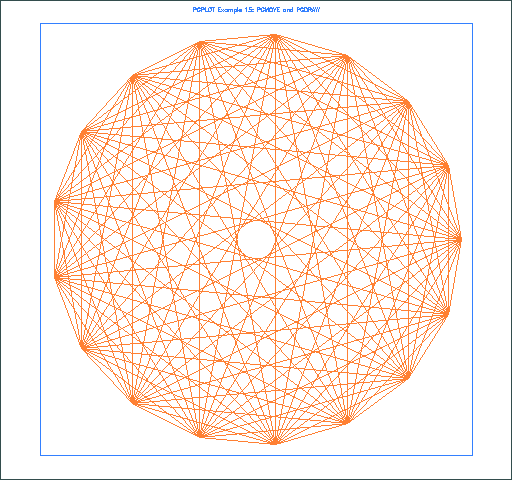
- Example 1-14 is a line-drawing test; it draws a regular n-gon
joining each vertex to every other vertex.
Page last updated 14 Feb 1999
Use your 'back' icon to return to the previous page or
click here to return to the 'Fortran Friends' home page.